Homepage
Weitere Optionen
Welcome to HITGuard Help!
Here, you will learn everything about risk management in management systems tailored to the score and needs of your organization. Including the ability to structure and archive your know-how in knowledge bases. Those knowledge bases include risks, threats, measures and controls.
You can also use HITGuard for workflow-based support of progress and control inquiries as part of tracking processes, e.g. after audits. Benefit from workflow-based request-reply mechanisms for executing control and progress tracking on various topics and interact efficiently with your colleagues.
Similarly, you benefit from a centralized collection of your data protection processing activities and workflow-driven collaboration to maintain these registers.
Menu navigation
All modules and their menu items are explained here.

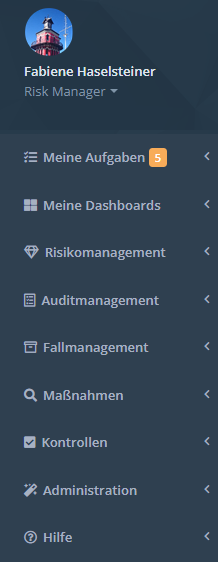
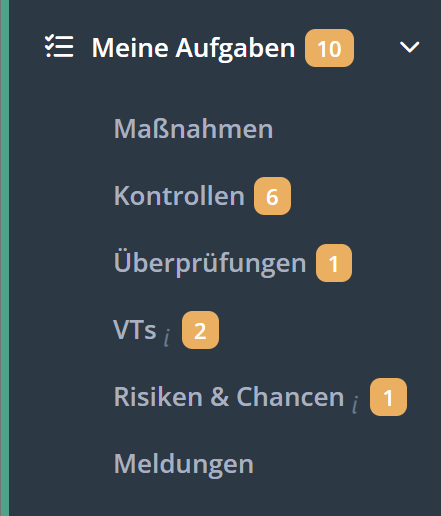
My Tasks
Under "My tasks" you will find the tasks you have to complete in your role as a practitioner. The menu on the left shows you at a glance if you have any pending tasks (orange number badge).
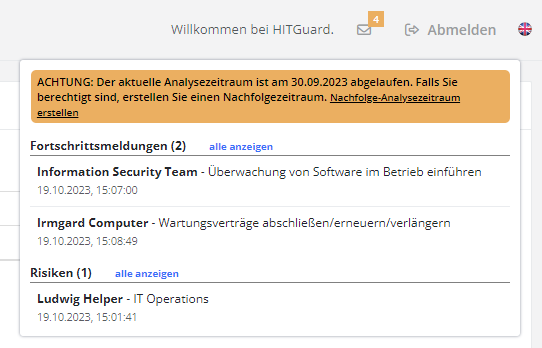
Current management tasks
The envelope in the upper right corner informs professionals and experts about tasks that have been reported completed and are waiting for completion/review. The tasks always refer to the current management system only. In addition, the tasks are only displayed to users who are authorized to edit them.
For example, answered processing activities are displayed only to users who are Data Protection professionals or experts and are currently in the Data Protection management system.

The tasks are divided into the following items:
- Risk management
- Protection needs analyses
- Protection needs analyses of the current management system that have been answered.
- Gap analyses
- Gap analyses of the current management system that have been answered.
- Hazard situations
- Hazard situations of the current management system that have been newly submitted or returned.
- Measures
- Progress reports
- Progress reports of the current management system that have been answered.
- Data protection management systems
- Processing activities
- Processing activities of the current management system that have been answered.
- Case management systems
- Unassigned reports
- Reports of the current management system to which no user has been assigned yet. If a support team is defined, these will only be displayed to the team members.
- Reports assigned to me
- Open reports of the current management system that are assigned to the current user. Closed and answered reports are not displayed.
My Dashboards
Dashboards are used to get an overview of the management systems. By default, each management system has a dashboard for risk management, for measures, and for controls. Data protection management systems also have a data protection dashboard, and case management systems have a case management dashboard. However, only dashboards for which the user is authorized are displayed.
In order for a user to access a dashboard, they need the "Expert", "Professional" or "Observer" role in the respective module. Thus, to view the risk management dashboard, at least the "Professional" role in risk management is required.
Additional dashboards can also be created and configured. It is possible to make these accessible only to oneself by marking them as "private". Dashboards that are not marked as "private" are visible to all authorized members of the management system.
Users can mark a dashboard as a favorite in each management system. This dashboard will be ranked first for the user and displayed when the user logs in. To mark it, click the star next to the dashboard configuration.
How to create and edit dashboards, as well as information on the Key Performance Indicators (KPIs) for each dashboard can be found here:
Risk management
- Risk Policy
- Structural analysis
- Protection needs
- Vulnerabilities
- Risk evaluation
- Risk treatment
- Reports for the risk management
Audit management
Case management
Measures
Controls
Data protection
Administration
- User and user-role assignment
- Teams
- Global settings
- Management systems
- OrgUnits
- Resources
- Data categories
- Processes
- Knowledge bases
- Standards and norms
- Documents
- Data import
- Jobs
Help
Under this menu item you will find the introduction "Getting started", which can restart the intro for HITGuard at any time.
Under the menu item "Online Help" you will find our help directly integrated in HITGuard.
If there is an info icon in the lower left corner, it can be clicked to start a short introduction to the current page.
User guides
Interface description
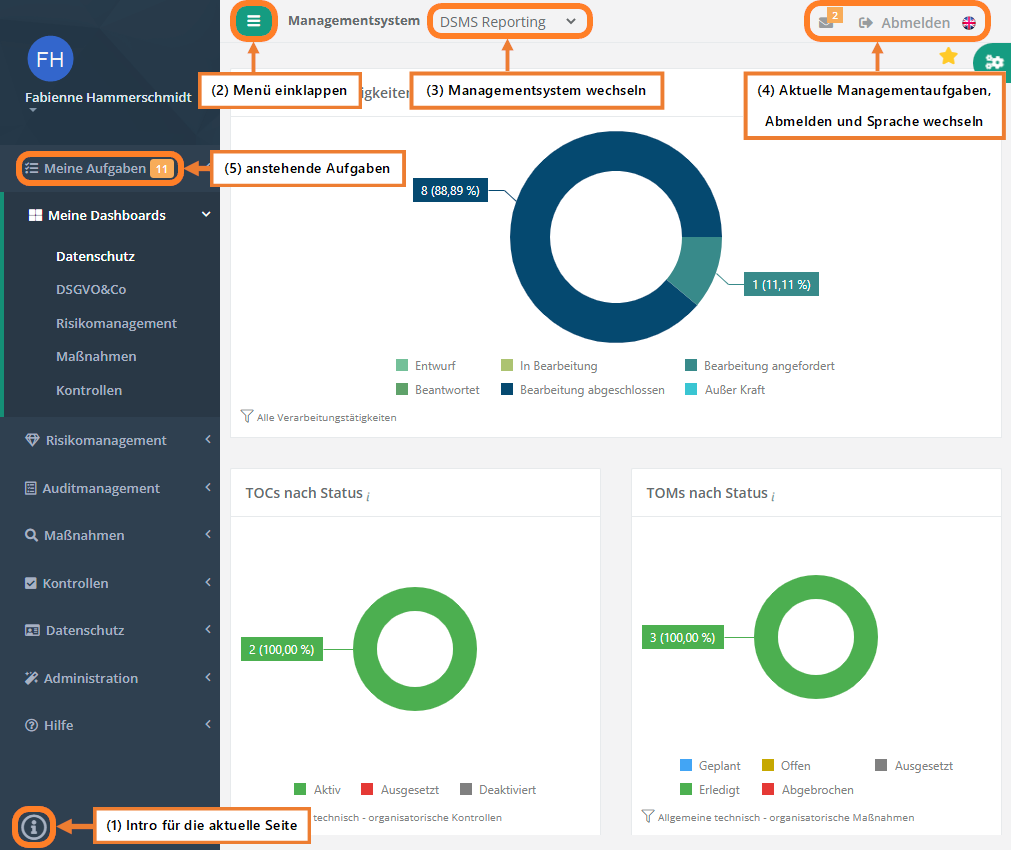
The following screenshot shows the various elements of the HITGuard interface.

Legend:
- Intro for the current page
- If the current page has an interactive introduction, it can be started via this icon.
- Open/collapse menu
- This button collapses the navigational menu or reopens it, respectively.
- Change management system
- If you have been assigned to multiple management systems, you can switch between them here. This option is not visible if you are a practitioner or have only been assigned to one management system.
- Current management tasks, logout, and change language
- The envelope gives information about your current management tasks.
- Logout logs you off the system.
- The flag can be used to switch between German and English.
- Pending tasks
- In My tasks you find the tasks you have to implement in your role as practitioner.
FAQ
Glossar
Working with the tables and symbols
Experts or Professionals
Administrators or Experts
Administrators
How To Start
Release Notes
- HITGuard Release June 2022
- HITGuard Release January 2022
- HITGuard Release September 2021
- HITGuard Release April 2021
- HITGuard Release January 2021
- HITGuard Release October 2020
- HITGuard Release July 2020
- HITGuard Release April 2020
- HITGuard Release December 2019
- HITGuard Release July 2019
- HITGuard Release April 2019
- HITGuard Release May 2019
Release Notes from the years 2017 and 2018 were directly integrated into the help.

