
Strukturanalyse/en: Unterschied zwischen den Versionen
Weitere Optionen
Faha (Diskussion | Beiträge) Keine Bearbeitungszusammenfassung |
KoKl (Diskussion | Beiträge) Die Seite wurde neu angelegt: „=== <span id="draft mode"></span>Draft mode === ----“ |
||
| (95 dazwischenliegende Versionen von 4 Benutzern werden nicht angezeigt) | |||
| Zeile 1: | Zeile 1: | ||
== Visualization == | The structural analysis is a central modeling tool that is reserved for [[Special:MyLanguage/Benutzer_und_Benutzerrollen#Expert|Expert users]]. Many other analyses feed into the structural analysis, enabling master data, dependencies, and risks to be related and evaluated. | ||
<span id="Visualisierung_&_Sichten"></span> | |||
== Visualization & Views == | |||
=== <span id="views"></span>Viewing areas === | === <span id="views"></span>Viewing areas === | ||
[[Datei:Strukturanalyse_5Sichten.png|right|thumb|Views of the structural analysis]] | |||
There are several views in the structural analysis to avoid confronting the user with an oversized and confusing graph. | There are several views in the structural analysis to avoid confronting the user with an oversized and confusing graph. These five perspectives are available: | ||
* | *The <b>organizational view</b> focuses on the organizational structure of the company/group/association. | ||
*The <b>resource view</b> represents the technical landscape and maps IT systems, specialized systems, building security, etc. | |||
*The <b>data view</b> shows which data is processed in which organizational units or processes. | |||
*The <b>process view</b> provides an overview of the business processes. | |||
*The <b>supplier view</b> allows you to model the suppliers on which your organization, especially its IT systems, depends. | |||
One view always constitutes the '''main view'''. The main view can be selected via the circular radio button or by double clicking the name of the view. Additional nodes from other views can be added to the main view. The link-buttons next to the the names of the views will take you to the respective administration pages in the tool. | |||
---- | |||
<span id="Organisationssicht"></span> | |||
=== <span id="org_view></span>Organization view === | |||
The organizational structure is described in [[Special:MyLanguage/OrgEh_-_Organisationseinheiten|Organizational Units]]. | |||
[[Datei:Beispiel Organisationssicht.PNG|right|thumb|400px|Example organizational view]] A company consists of organizational units that are involved in various processing activities. These processes take place within one or more units and are usually IT-supported, with data being processed in the individual process steps.<p> | |||
From this perspective, key questions can be answered, such as dependencies on IT systems, risks to availability, confidentiality, and integrity (e.g., from business impact analyses), as well as the types of data processed and activities per organizational unit.<p> | |||
As a general rule: the more critical an organizational unit, the higher the potential damage — and the stricter the requirements for availability, confidentiality, and integrity. | |||
Therefore, you must map the <b>organizational structure</b> and enter it either here or under Administration > [[Special:MyLanguage/OrgEh_-_Organizational Units|Organizational Units]]. | |||
You can also perform a protection need analysis to determine the business impact of IT services on the department’s day-to-day operations ([[Determine the Criticality of an Organizational Unit]]) | |||
<br clear=all> | |||
<span id="Ressourcensicht"></span> | |||
=== <span id="Resource view"></span>Resource view=== | |||
''' | [[Datei:Beispiel Ressourcensicht.PNG|right|thumb|500px|Example: resource view]] The resource view represents the technical landscape, depicting IT systems, specialized systems, building security, etc. The risk analysis is also carried out using this representation. Deviations in risk assessment in both technical and organizational areas become apparent here. Based on this, measures to eliminate the deviations must be planned.<p> | ||
This view of the IT systems, which can be divided into several categories, shows how dependencies between the systems exist. Any interactions can be illustrated in the structural analysis. You can find more about this under [[Special:MyLanguage/Ressource|Resources]].<p> | |||
'''Example:''' The three SAP modules run on the same server cluster and the same database. Therefore, a failure of the server or the database would affect all three modules. (You can learn more about relationships between elements further below) | |||
<br clear=all> | |||
<span id="Datensicht"></span> | |||
=== <span id="Data view"></span>Data view === | |||
[[Datei:Beispiel Datensicht.PNG|right|thumb|400px|Example data view]] In the data view, the structure of the managed data categories becomes apparent. In addition, relationships (see below) can be used to determine which data is processed in which organizational units, resources, or processes, who the data owners are, and how the data is classified (into distinctions between data classes or between personal and non-personal data). <p> If this view is linked with the process view, it becomes clear which data is processed in which processes. The creation and structuring of data categories is described in the article [[Special:MyLanguage/Datenkategorien| data categories]]. | |||
<br clear=all> | |||
<span id="Prozesssicht"></span> | |||
=== <span id="Process view"></span>Process view === | |||
[[Datei:Beispiel | [[Datei:Beispiel Prozesssicht.PNG|right|thumb|400px|Example process view]] In the process view, you can see all processes with their hierarchy. Processes make it clear which processes exist, which data they process, which resources are linked to them, and how strongly an organizational unit depends on a process and vice versa. How to create and structure processes is described in the article [[Special:MyLanguage/Prozesse|Processes]]. | ||
<br clear=all> | <br clear=all> | ||
<span id="Lieferantensicht"></span> | |||
===Supplier view=== | |||
If the add-on [[Special:MyLanguage/Supplier_Risk_Management|Supplier Risk Management]] is activated, you will see all [[Special:MyLanguage/Lieferanten|suppliers]] in the supplier view. Normally, they are not connected to each other. This makes it even more important to understand which organizational units, resources, data, and processes they are associated with and which risks are linked to them. | |||
: | |||
[[Datei:Lieferantensicht.png|left|thumb|900px|Example supplier view]] | |||
<br clear=all> | <br clear=all> | ||
=== | ===Relationships between elements=== | ||
Structural elements (business applications or IT infrastructure services) can be related to each other. These relationships are either hierarchical relationships or dependency relationships.<p> | |||
[[Datei:Screenshot_2025-10-23_090056.png|right|thumb|500px]] | |||
<b>Hierarchical relationships</b>, also called parent-child relationships, exist between entities within a view. They describe that one element is partly composed of another. A process can consist of subprocesses, data categories can contain other data categories, and organizational units together form larger organizations. Therefore, these hierarchical parent-child relationships only exist within the organizational, data category, and process views. Hierarchical relationships are represented by a simple line. <p> | |||
::<u>Example:</u> Organizational units, processes, and data categories with hierarchical relationships<br clear=all> | |||
<b>Dependency relationships</b>, on the other hand, illustrate that an element depends on another. This is the case for resources: an application runs on a server and is thus dependent on it in order to function. Additionally, dependency relationships can exist between different types of master data: if an application is provided by an external service provider, it depends on that supplier. If the employees of an organizational unit use an application, the organizational unit depends on the application. Dependency relationships are always depicted as arrows, with the element that depends on another pointing to the element that it needs in order to function.<p> | |||
::<u>Example:</u> The organizational unit “Procurement” depends on the applications BankingPortal and SAP MM. While BankingPortal depends on an external service provider, SAP runs on a server within the organization.<br clear=all> | |||
[[Datei: | [[Datei:Screenshot_2025-10-23_093659.png|right|thumb|500px]] Such a dependency relationship is composed of different <b>protection objectives</b>. The degree of dependency can vary for each protection target. For procurement, for example, it is very important that the integrity of the data in the Application "BankingPortal" is correct; otherwise, incorrect payments would be processed. However, if the application is unavailable for some time, the impact on the company is expected to be lower, as payments can also be processed on another day.<p> | ||
::<u>Example</u>: Switch from “Show bundled” to “Show all” in the navigation box, and you will see that there is a dependency relationship for each protection target.<p> | |||
The degree of dependency is weighted using a percentage value. By default, the dependency relationship is weighted at 100%, but other weightings are also possible. Typically, these weightings are determined by conducting a [[Special:MyLanguage/Schutzbedarf|protection needs analysis]]. HITGuard will translate the results of the protection needs analysis into the weightings of the dependency relationships. The background setting for this function is called “PNA edge weight.” You can find it in the [[Special:MyLanguage/Risikopolitik#Schutzbedarf|risk policy]]. | |||
'''Attention:''' If the first protection needs analysis has not yet been completed, all weightings will be 100% (HITGuard always assumes the worst case in this respect). Only once the protection needs analysis has been completed will the actual weightings of the damage extents be entered. | |||
<b>Creating and editing dependency relationships:</b> | |||
[[Datei:Knoten erstellen mit Rechtsklick.gif|right|thumb|400px|Create relationship with right-click]]To create a dependency relationship, first locate the element from which the relationship should originate (the deendent element). Right-click on the element and select "Add relationship" from the menu. Then left-click on the element with which you want to create the relationship (start point to end point)<br> | |||
[[Datei: | To delete a relationship, double-click on the relationship to open the detail page. There you can delete the relationship using the trash can button. Do not forget to click "Save" afterwards so that the relationship is actually deleted. | ||
<br clear=all> | <br clear=all> | ||
<span id="Arbeiten_mit_der_Strukturanalyse"></span> | |||
== <span id="Interface"></span>Working with the structure analysis== | == <span id="Interface"></span>Working with the structure analysis== | ||
The following figure shows the configuration area of the structural analysis on the right: | The following figure shows the configuration area of the structural analysis on the right: | ||
[[ | [[Datei:Beschreibung Entwurfsmodus.png|left|thumb|804px|Structural analysis with configuration area (right)]] | ||
<br clear=all> | <br clear=all> | ||
* You can switch between the "Design mode" and the "Analysis mode" by clicking on the switch button. This button always shows the currently active mode. | * You can switch between the "Design mode" and the "Analysis mode" by clicking on the switch button. This button always shows the currently active mode. | ||
* Double-clicking on a view changes it to the main view. The underlined view is always the main view. All entities are always displayed from the main view! | * Double-clicking on a view changes it to the main view. This can also be achieved using the radio | ||
buttons. The underlined view is always the main view. All entities are always displayed from the main view! | |||
* In the individual views you can select which elements should be displayed in the current context. | * In the individual views you can select which elements should be displayed in the current context. | ||
* In the organization layer there is an additional option for selecting all organizational units active in the management system. | * In the organization layer there is an additional option for selecting all organizational units active in the management system. | ||
* If you select a node, all organizational units below it are also activated. If you want to avoid this, you need to select the node with a right click and a click on "Select". | |||
* Resource groups can be shown and hidden in the resource view. | |||
* In the organization layer there is an additional option for selecting all organizational units active in the management system. | * In the organization layer there is an additional option for selecting all organizational units active in the management system. | ||
| Zeile 81: | Zeile 105: | ||
<b>Important: Select damage extent classification!</b> | <b>Important: Select damage extent classification!</b> | ||
* If more than one damage extent classification exists, then they are selectable here. Only SBA protection target weightings of the current damage extent classification are displayed. Furthermore, the [[ | * If more than one damage extent classification exists, then they are selectable here. Only SBA protection target weightings of the current damage extent classification are displayed. Furthermore, the [[Special:MyLanguage/Risikopolitik#Schutzzielausprägungen|Protection target weighting]] of a protection target is displayed, if available. | ||
By clicking on a | By clicking on a risk, a dialog opens through which you can switch to the detail page of the risk. | ||
[[Datei:Beschreibung Entwurfsmodus Gefährdungslagen.png|left|thumb|801px| | [[Datei:Beschreibung Entwurfsmodus Gefährdungslagen.png|left|thumb|801px|Risks]] | ||
<br clear=all> | <br clear=all> | ||
<span id="Sichten_kombinieren"></span> | |||
=== Combine views === | === Combine views === | ||
In addition to the main view, individual or all entities from other views can also be displayed. The combination of views is freely configurable, i.e. there are no restrictions on how the views can be combined. To add another view to the main view, you have to select the check mark in the navigation area of the structure analysis for the desired view and then click on "Apply". | In addition to the main view, individual or all entities from other views can also be displayed. The combination of views is freely configurable, i.e. there are no restrictions on how the views can be combined. To add another view to the main view, you have to select the check mark in the navigation area of the structure analysis for the desired view and then click on "Apply". | ||
The combination of views is especially practical when connections between different entity types are to be created or analyzed. These combined views can be saved as configurations for reuse, for example, to analyze the impact of a measure. | The combination of views is especially practical when connections between different entity types are to be created or analyzed. These combined views can be saved as configurations for reuse, for example, to analyze the impact of a measure. | ||
< | Note: | ||
* In the <u>organization view</u> every unit can be shown and hidden individually. If you select a node, all organizational units below it are also activated. If you want to avoid this, you need to select the node with a right click and a click on "Select". This selects the unit without the units below it. | |||
* For <u>resources</u>, you cannot show and hide individual resources. Instead, you can show and hide model segments as well as resource groups collectively. If you want to hide resource groups, you must not forget to deselect the model segment above it. Available model segments are: Business Service Level, Application Level, IT-infrastructure Level, OT-Infrastructure Level, Physical Security, Process Level. | |||
*<u>Data categories</u> can be shown and hidden like organizational units. | |||
*<u>Processes</u> can be shown and hidden like organizational units. | |||
*<u>Suppliers</u> (only available if the add-on is activated) can be shown and hidden like organizational units. | |||
<b>Important:</b> | <b>Important:</b> | ||
* Depending on whether you are working in design or analysis mode, all or only explicitly selected entities (namely those to which relationships already exist from the main view) are displayed from the additionally selected views. | * Depending on whether you are working in design or analysis mode, all or only explicitly selected entities (namely those to which relationships already exist from the main view) are displayed from the additionally selected views. | ||
<span id="Knoten_finden_(Alt_+_s)"></span> | |||
==== Find node (Alt + s) ==== | ==== Find node (Alt + s) ==== | ||
In more extensive views, the search is supported to quickly get to a specific node. | |||
In more extensive views, the search is supported to quickly get to a specific node. | |||
To do this, enter the search term of the node in the "Find node..." field and complete your entry with the Enter or Enter key. The search then centers the first node found. If the Enter or Enter key is pressed again, the next node found is centered, and so on. When the end of the search result is reached, a message is displayed. If the Enter key is pressed again, the first search result is displayed again. | To do this, enter the search term of the node in the "Find node..." field and complete your entry with the Enter or Enter key. The search then centers the first node found. If the Enter or Enter key is pressed again, the next node found is centered, and so on. When the end of the search result is reached, a message is displayed. If the Enter key is pressed again, the first search result is displayed again. | ||
The search is case-insensitive. Special word beginnings, endings or phrases can be found with an asterisk (*): | The search is case-insensitive. Special word beginnings, endings or phrases can be found with an asterisk (*): | ||
* sap* finds "SAP MM" and "SAP HCM" and "SAP FI/CO," for example, | * sap* finds "SAP MM" and "SAP HCM" and "SAP FI/CO," for example, | ||
| Zeile 119: | Zeile 141: | ||
* *mm finds "SAP MM" and "HR master". | * *mm finds "SAP MM" and "HR master". | ||
*fi* finds "SAP FI/CO" and "Finance". | *fi* finds "SAP FI/CO" and "Finance". | ||
=== Configurations === | === Configurations === | ||
---- | |||
Configurations save all settings that were available at the time of saving. I.e. it saves which view was the main view, which views or entities were additionally displayed, how the protection targets are displayed and whether the risks should be displayed. | |||
Configurations save all settings that were available at the time of saving. I.e. it saves which view was the main view, which views or entities were additionally displayed, how the protection targets are displayed and whether the | |||
Configurations can be used above all to divide large and complex structures into different configurations and thus display them in a clear manner. This makes working with large structures much easier. | Configurations can be used above all to divide large and complex structures into different configurations and thus display them in a clear manner. This makes working with large structures much easier. | ||
The cloud icons can be used to save the current configuration or to load an existing configuration. | |||
The cloud icons can be used to | |||
Example of the use of a configuration: | Example of the use of a configuration: | ||
* A protection needs analysis was performed and the impact was analyzed in the structural analysis. The next step is to define and implement measures for the | * A protection needs analysis was performed and the impact was analyzed in the structural analysis. The next step is to define and implement measures for the risks that have arisen. If the previously performed structural analysis is stored in a configuration, the same analysis can be performed again with comparably little effort and thus the effects of the measures can be analyzed. | ||
=== | === Show dependencies === | ||
---- | ---- | ||
Right-clicking on a node in the graph opens a context menu with the option "Show dependencies". | |||
This option allows to limit the structure analysis to the elements relevant for the selected node. This can help to get a better and clearer overview of the dependencies and also facilitates the analysis. | |||
An example to clarify: | |||
I am just interested in the resource SAP MM and would like to know what this resource depends on, but I have a hard time seeing this because so many nodes are displayed. | |||
I can right click on SAP MM and select "Show dependencies". This hides all non-relevant nodes and gives me a much better overview. | |||
{| | |||
|- | |||
[[Datei:SA Zeige Abhängigkeiten 2.PNG | |[[Datei:SA Zeige Abhängigkeiten 1.PNG|thumb|300px]] | ||
|[[Datei:SA Zeige Abhängigkeiten 2.PNG|thumb|300px]] | |||
|- | |||
|<i>richt click with menu</i> | |||
|<i>resulting view</i> | |||
|} | |||
<br clear=all> | <br clear=all> | ||
| Zeile 161: | Zeile 179: | ||
---- | ---- | ||
In design mode, you can place elements from the selected views in connections and define their dependencies based on protection goals. However, you cannot edit connections or protection goal weights if they have been defined by a protection needs analysis. To edit them, you must perform a new protection needs analysis. | In design mode, you can place elements from the selected views in connections and define their dependencies based on protection goals. However, you cannot edit connections or protection goal weights if they have been defined by a protection needs analysis. To edit them, you must perform a new protection needs analysis. | ||
In design mode, <b>all</b> entities from the selected views are displayed. This has the purpose that relationships can be created between all elements. | In design mode, <b>all</b> entities from the selected views are displayed. This has the purpose that relationships can be created between all elements. | ||
<span id="Elemente_bewegen"></span> | |||
==== <span id="Move elements"></span>Move elements ==== | ==== <span id="Move elements"></span>Move elements ==== | ||
You can move elements individually or several elements at the same time. To move an element individually you have to move the mouse pointer over the desired element and click and hold the left mouse button. | You can move elements individually or several elements at the same time. To move an element individually you have to move the mouse pointer over the desired element and click and hold the left mouse button. | ||
To move multiple elements you have two options: | To move multiple elements you have two options: | ||
# Hold down the left mouse button until a cross appears. Then drag the rectangle over the elements you want to move. | # Hold down the left mouse button until a cross appears. Then drag the rectangle over the elements you want to move. | ||
# Hold down CTRL to select multiple elements by clicking on them. | # Hold down CTRL to select multiple elements by clicking on them. | ||
| Zeile 184: | Zeile 197: | ||
[[Datei:Markieren mit STRG gedrückt.gif|left|thumb|800px|select and move multiple elements with CTRL pressed]]<br clear=all> | [[Datei:Markieren mit STRG gedrückt.gif|left|thumb|800px|select and move multiple elements with CTRL pressed]]<br clear=all> | ||
<span id="Beziehungen_erstellen_/_bearbeiten"></span> | |||
==== <span id="Create node"></span>Create / edit node ==== | ==== <span id="Create node"></span>Create / edit node ==== | ||
To connect elements with each other there are several possibilities: | To connect elements with each other there are several possibilities: | ||
# Right-click on an element and select "Add relationship". Then select other element. (Starting point to end point)<br>[[ | # Right-click on an element and select "Add relationship". Then select other element. (Starting point to end point)<br>[[Datei:Knoten erstellen alt.gif|left|thumb|800px|Create node with right click]]<br clear=all> | ||
# Hold down "Alt" and select element 1, then click on the second element.<br>[[ | # Hold down "Alt" and select element 1, then click on the second element.<br>[[Datei:Knoten erstellen alt.gif|left|thumb|800px|Create node with "Alt"-pressed]]<br clear=all> | ||
# For data, processes, and organizational units, if you double-click the item, you can select a parent item in the mask or unlink it from the parent item.<br>[[ | # For data, processes, and organizational units, if you double-click the item, you can select a parent item in the mask or unlink it from the parent item.<br>[[Datei:Knoten erstellen Datenkategorie.gif|left|thumb|800px|Create data-category node via mask]]<br clear=all> | ||
# For resources, if you double-click on the element, you can create new connections or edit existing ones via the "Relationships" tab in the mask.<br>[[ | # For resources, if you double-click on the element, you can create new connections or edit existing ones via the "Relationships" tab in the mask.<br>[[Datei:Knoten erstellen Ressource.gif|left|thumb|800px|Create Node of a Resource]]<br clear=all> | ||
<span id="Schutzziel_bearbeiten_/_löschen"></span> | |||
==== <span id="Edit protection target"></span>Edit/delete protection target==== | ==== <span id="Edit protection target"></span>Edit/delete protection target==== | ||
The connection with resources always happens with protection goals. However, you can adapt these protection goals. Exceptions are protection goals that have been weighted by protection needs analyses. These can only be changed by a new protection needs analysis (to create protection targets see [[Special:MyLanguage/Risikopolitik#protar|protection targets]]), even if you can normally delete them. | |||
The connection with resources always happens with protection goals. However, you can adapt these protection goals. Exceptions are protection goals that have been weighted by protection needs analyses. These can only be changed by a new protection needs analysis (to create protection | |||
[[Datei:Strukturanalyse BIA Schutzziele.PNG|left|thumb|800px|The protection needs analysis protection goals cannot be edited]]<br clear=all> | [[Datei:Strukturanalyse BIA Schutzziele.PNG|left|thumb|800px|The protection needs analysis protection goals cannot be edited]]<br clear=all> | ||
To edit the protection targets of a connection you have to either double-click on the connection arrows or double-click on the element and switch to the "Relations" tab. With the latter option, no weightings can be set. Here, a 100% weighting is always assumed. | To edit the protection targets of a connection you have to either double-click on the connection arrows or double-click on the element and switch to the "Relations" tab. With the latter option, no weightings can be set. Here, a 100% weighting is always assumed. | ||
[[Datei:Schutzziele bearbeiten.gif|left|thumb|800px|Delete protection target]]<br clear=all> | [[Datei:Schutzziele bearbeiten.gif|left|thumb|800px|Delete protection target]]<br clear=all> | ||
| Zeile 210: | Zeile 219: | ||
[[Datei:Schutzziele über Reiter bearbeiten.PNG|left|thumb|800px|Edit protection targets via "Relationships" tab]]<br clear=all> | [[Datei:Schutzziele über Reiter bearbeiten.PNG|left|thumb|800px|Edit protection targets via "Relationships" tab]]<br clear=all> | ||
<span id="Elemente_erstellen_/_bearbeiten_/_löschen"></span> | |||
==== <span id="Create elements"></span>Create / edit / delete elements ==== | ==== <span id="Create elements"></span>Create / edit / delete elements ==== | ||
Right-click into the empty space in the structure analysis to create new resources, organizational units, processes or data categories. If you now select an element to create, the respective mask for creating the new element opens. | |||
Right-click into the empty space in the structure analysis to create new resources, organizational units, processes or data categories. If you now select an element to create, the respective mask for creating the new element opens. | |||
</ | <u>Note:</u> If a sub- or superordinate resource is created, it is automatically created as the type resource and this cannot be changed. | ||
Double-click on an element to open its "edit" mask. Here you can also delete the elements. | Double-click on an element to open its "edit" mask. Here you can also delete the elements. | ||
For more details see [[Special:MyLanguage/Ressourcen|Resources]], [[Special:MyLanguage/OrgEh_-_Organisationseinheiten#orgcre|Organizational Unit]], [[Special:MyLanguage/Prozesse|Processes]], [[Special:MyLanguage/Datenkategorien#datacat|Data Category]] create / edit / delete. | |||
For more details see [[Resources]], [[OrgEh_- | |||
[[Datei:Element mit Rechtsklick erstellen.png|left|thumb|800px|Create element with right click]]<br clear=all> | [[Datei:Element mit Rechtsklick erstellen.png|left|thumb|800px|Create element with right click]]<br clear=all> | ||
| Zeile 228: | Zeile 234: | ||
=== <span id="Analysis mode"></span>Analysis mode === | === <span id="Analysis mode"></span>Analysis mode === | ||
The analysis mode is used to analyze the company structure. You can analyze which elements are dependent on each other and in what way. For this you can choose how the dependency should be displayed: | The analysis mode is used to analyze the company structure. You can analyze which elements are dependent on each other and in what way. For this you can choose how the dependency should be displayed: | ||
* What do I depend on? | * What do I depend on? | ||
* What do I depend on? | * What do I depend on? | ||
Additionally you can define a threshold value. This determines from which percentage dependency a connection between 2 elements should be displayed. | Additionally you can define a threshold value. This determines from which percentage dependency a connection between 2 elements should be displayed. | ||
Analysis mode displays <b>only</b> entities from the selected views that are related to an entity from the main view. | Analysis mode displays <b>only</b> entities from the selected views that are related to an entity from the main view. | ||
<span id="Was_hängt_von_mir_ab?"></span> | |||
==== <span id="What depends on me?"></span>What depends on me? ==== | ==== <span id="What depends on me?"></span>What depends on me? ==== | ||
This can be used to analyze how much other entities, in terms of their protection goals, depend on an entity. | This can be used to analyze how much other entities, in terms of their protection goals, depend on an entity. | ||
It is also possible to examine how risks affect the entire structure. It is also possible to examine how they affect the individual protection goals. This makes it possible to quickly identify how a risk affects other entities. | It is also possible to examine how risks affect the entire structure. It is also possible to examine how they affect the individual protection goals. This makes it possible to quickly identify how a risk affects other entities. | ||
Entities on which the selected entity does not depend are grayed out. | Entities on which the selected entity does not depend are grayed out. | ||
[[Datei:Risiko visualisieren.gif|left|thumb|900px|Risk effects]] | [[Datei:Risiko visualisieren.gif|left|thumb|900px|Risk effects]] | ||
| Zeile 259: | Zeile 258: | ||
<br clear=all> | <br clear=all> | ||
<span id="Wovon_hänge_ich_ab?"></span> | |||
==== <span id="What do I depend on?"></span>What do I depend on? ==== | ==== <span id="What do I depend on?"></span>What do I depend on? ==== | ||
This can be used to examine how much an entity | This can be used to examine how much an entity depends on other entities in terms of its protection targets. | ||
The dependency can be examined on a protection goal basis either bundled or individually for each protection goal. By changing the threshold value, you can set the percentage weighting of the protection goal from which you depend on an entity. | The dependency can be examined on a protection goal basis either bundled or individually for each protection goal. By changing the threshold value, you can set the percentage weighting of the protection goal from which you depend on an entity. | ||
Entities on which the selected entity does not depend are displayed in gray. | Entities on which the selected entity does not depend are displayed in gray. | ||
[[Datei:Wovon hänge ich ab Schwellwert.gif|left|thumb|900px|What do I depend on?]] | [[Datei:Wovon hänge ich ab Schwellwert.gif|left|thumb|900px|What do I depend on?]] | ||
<br clear=all> | <br clear=all> | ||
==== <span id="RTO"></span>RTO | <span id="RTO_und_RPO_Erfüllung"></span> | ||
==== <span id="RTO"></span>RTO and RPO fulfillment ==== | |||
In | In the structural analysis, the fulfillment of the RTO (Recovery Time Objective) and RPO (Recovery Point Objective) can also be analyzed. | ||
[[Datei:SA RTO Erfüllung.png||left|thumb|901px| RTO | [[Datei:SA RTO Erfüllung.png||left|thumb|901px| RTO fulfillment]] | ||
<br clear=all> | <br clear=all> | ||
<b> | <b>Attention:</b> | ||
In order for RTO or RPO fulfillment to be examined in the structural analysis, the RTO or RPO protection target must be activated under [[Special:MyLanguage/Risikopolitik#Schutzziele| "Risk Management → Risk Policy → Protection Targets"]]. Otherwise the checkboxes are not shown in the structural analysis. | |||
The RTO or RPO fulfillment shows whether the protection requirement can be met with regard to RTO or RPO for the respective resources. For this purpose, the edge to the resources is weighted in the graph with a TARGET and ACTUAL. The target value is taken from a [[Special:MyLanguage/Schutzbedarf | Protection requirement analysis ]]. The ACTUAL is calculated from the respective dependent resources, i.e. the maximum time of <b>all</b> dependent resources for the RTO or RPO is determined. | |||
<u>Note:</u> If you are in the combined view organization view (main view) and resource view (application layer shown) and at this point show RTO and RPO, you may see IS-values for the compliance that do not reflect the value of the resources below them. That is because all dependent resources (meaning the resources of all layers, even if they are not shown) are calculated. You can show this by enabling Show dependencies for the organizational unit. | |||
<big>''' | <big>'''Procedure''</big> | ||
* | * Protection needs analysis | ||
:: | ::In order to analyze whether the RPO or RTO for a resource is met, a protection needs analysis for the resources must first be performed with an organizational unit or process owner. This results in the TARGET or no requirement. | ||
* | * Evaluate resources | ||
:: | :: In order to calculate the ACTUAL for RTO or RPO, the resources on which the organizational unit or process to be examined depends must be evaluated according to RTO or RPO. There are three possibilities for this: | ||
::* | ::* not evaluated: | ||
:::RTO | :::RTO or RPO has not yet been evaluated / entered. These values are not included in the calculation, but are marked as not yet evaluated (yellow gear wheel for RTO and yellow clock for RPO). | ||
[[Datei:SA RTO nicht bewertet.PNG|left|thumb|left| RTO | [[Datei:SA RTO nicht bewertet.PNG|left|thumb|left| RTO not rated]] | ||
<br clear=all> | <br clear=all> | ||
::* | ::* undefined / not relevant: | ||
::: | ::: The RTO or RPO is not further relevant for the calculation. These values are also not included in the calculation, but are marked with a gray symbol to show that these values were deliberately not deposited. | ||
[[Datei:SA RTO nicht relevant.PNG | [[Datei:SA RTO nicht relevant.PNG|left|thumb|901px| RTO undefined]] | ||
<br clear=all> | <br clear=all> | ||
::* RTO | ::* RTO recovery time or the RPO backup interval is present: | ||
::: | ::: The RTO or RPO has already been determined for resources. These values can then be stored for the resources. | ||
::: | ::: For RTO there is the additional option that the recovery time of third party resources are secured e.g. by a SLA. This SLA can be deposited with the resource. | ||
::: N / B | ::: N / B means net or gross. Net is the value that is entered directly at the resource. Gross is the maximum time reached by all dependent paths (only longest path is relevant). | ||
[[Datei:SA RTO bewertet.PNG | [[Datei:SA RTO bewertet.PNG|left|thumb|901px| RTO rated]] | ||
<br clear=all> | <br clear=all> | ||
* RTO | * Analyze RTO or RPO Fulfillment: | ||
:: | :: In order to analyze fulfillment, at least the organization view and resource view must be selected in the structure analysis. If these are selected, it is necessary to switch to the analysis mode (switch at the very top of the right menu). In the analysis mode, RTO or RPO fulfillment can now be selected. | ||
:: | :: If too many non-relevant resources or organizational units are displayed, one can right-click on the organizational unit to be analyzed and select the item "Show dependencies" in the context menu. This will hide all non-relevant nodes. | ||
[[Datei:SA RTO Erfüllung 2.PNG | [[Datei:SA RTO Erfüllung 2.PNG|left|thumb|901px| RTO Fulfillment]] | ||
<br clear=all> | <br clear=all> | ||
<span id="Durchführung_einer_Strukturanalyse"></span> | |||
== <span id="implementation"></span>implementation of a structural analysis == | == <span id="implementation"></span>implementation of a structural analysis == | ||
| Zeile 319: | Zeile 319: | ||
The application has different weightings for different business areas with regard to its protection goals. The most critical weighting specifies how technically demanding the resource must be designed with regard to its protection goals, e.g., availability, confidentiality, or integrity. In this way, critical risks can be defined for the applications based on the weighting of their protection goals. | The application has different weightings for different business areas with regard to its protection goals. The most critical weighting specifies how technically demanding the resource must be designed with regard to its protection goals, e.g., availability, confidentiality, or integrity. In this way, critical risks can be defined for the applications based on the weighting of their protection goals. | ||
'''Example:'' | '''Example:'' | ||
:Confidential customer data is stored on a hard disk. This data is rarely used in the HIS, so its availability has been weighted to 20%. However, the confidentiality is 100% because it is confidential data. This allows, for example, the risks of theft and server failure to be identified. By weighting, it can be seen that theft of confidential data is much more critical than server failure. That is, theft would be a critical risk, but server failure would not. | :Confidential customer data is stored on a hard disk. This data is rarely used in the HIS, so its availability has been weighted to 20%. However, the confidentiality is 100% because it is confidential data. This allows, for example, the risks of theft and server failure to be identified. By weighting, it can be seen that theft of confidential data is much more critical than server failure. That is, theft would be a critical risk, but server failure would not. | ||
Resources may be interdependent. There may be resources that are not functional or have limited functionality if another resource is not available. Resources require, for example, an IT infrastructure, data storage and possibly medical devices in order to be functional. | Resources may be interdependent. There may be resources that are not functional or have limited functionality if another resource is not available. Resources require, for example, an IT infrastructure, data storage and possibly medical devices in order to be functional. | ||
These dependencies can also be bidirectional. This would be the case, for example, if two resources (e.g. applications) actively exchange data. If one of them were to fail, this would affect the other resource. | These dependencies can also be bidirectional. This would be the case, for example, if two resources (e.g. applications) actively exchange data. If one of them were to fail, this would affect the other resource. | ||
All these dependencies can be analyzed via structural analysis. | All these dependencies can be analyzed via structural analysis. | ||
<!-- | |||
== <span id="Logic"></span>Logic of relationships between entities == | == <span id="Logic"></span>Logic of relationships between entities == | ||
Structural elements (business applications or IT infrastructure services) can be interrelated. Between two related structural elements, there is one type of relationship per protection objective. The '''direction of the relationship''' and the weighting of the dependency are defined for each protection objective. By default, the weighting of the relationship is 100%, but a different weighting can also be set. All these relations can be uni- or bidirectional. This defines the dependencies of the objects to each other. | Structural elements (business applications or IT infrastructure services) can be interrelated. Between two related structural elements, there is one type of relationship per protection objective. The '''direction of the relationship''' and the weighting of the dependency are defined for each protection objective. By default, the weighting of the relationship is 100%, but a different weighting can also be set. All these relations can be uni- or bidirectional. This defines the dependencies of the objects to each other. | ||
''Example:'' A hospital information system (HIS) and a laboratory information system (LIS) are related to each other | ''Example:'' A hospital information system (HIS) and a laboratory information system (LIS) are related to each other | ||
''Protection goal availability:'' The LIS is 100% dependent on the HIS. If the HIS is not functioning, the LIS cannot access the patient master data and work cannot be performed. The HIS, on the other hand, is only 10% dependent on the LIS in our example. If the LIS is not functioning, the HIS cannot retrieve the laboratory values, but all other functions are available without restriction. | ''Protection goal availability:'' The LIS is 100% dependent on the HIS. If the HIS is not functioning, the LIS cannot access the patient master data and work cannot be performed. The HIS, on the other hand, is only 10% dependent on the LIS in our example. If the LIS is not functioning, the HIS cannot retrieve the laboratory values, but all other functions are available without restriction. | ||
--> | |||
==Screen configuration== | |||
In the bottom left corner of the structural analysis view you find five options: | |||
#Zoom bar: zoom in or out of the view | |||
#Fit to screen: center the structural analysis on your screen | |||
#Rearrange elements: let the tool position the elements automatically | |||
#Lock all/Unlock all: lock or unlock all the elements' positions | |||
#Toggle fullscreen mode: use the full screen for your structural analysis | |||
<!--- | <!--- | ||
This step can also be done without a previous step of the protection needs analysis by mapping all systems that are to be considered (for whatever reason they are selected, e.g. in the context of an implementation project). | This step can also be done without a previous step of the protection needs analysis by mapping all systems that are to be considered (for whatever reason they are selected, e.g. in the context of an implementation project). | ||
Alternatively, a targeted risk analysis can be started for those systems that have emerged as critical services as a result of the protection requirements analysis (or systems for processes / departments that appear to be critical). Based on the results of the protection requirements analysis, a targeted risk investigation is possible. The risk identification looks at the systems with the highest protection requirements from the department/process analyses. | Alternatively, a targeted risk analysis can be started for those systems that have emerged as critical services as a result of the protection requirements analysis (or systems for processes / departments that appear to be critical). Based on the results of the protection requirements analysis, a targeted risk investigation is possible. The risk identification looks at the systems with the highest protection requirements from the department/process analyses. | ||
---> | ---> | ||
</ | |||
==Tips, tricks & best practice== | |||
[[Datei:BESTPRACTICE.png|left|thumb|100px]] | |||
*Sometimes, less is more. Especially at the beginning of working with the tool, an imported CMDB can lead to more pain than gain if a user is faced with a veritable mountain of assets into which they want to incorporate relationships and comprehensible dependences. | |||
*Rather, build your management system step by step. Model the organizational structure with the most vital areas of your company. Collect the core processes and the most important services of your organization. Group and cluster similar elements (e.g., load balancing servers). | |||
*Do not record central structural elements, such as the Active Directory, which is linked to almost all areas of business. It does not necessitate an analysis to know that an interruption of the AD would lead to a bigger problem in the company. <u>Note</u>: Of course, such an element can still be regarded and analyzed in HITGuard, especially regarding its security configuration. For this, HITGuard offers the gap analysis and its related functions.<br clear=all> | |||
Aktuelle Version vom 7. August 2026, 21:51 Uhr
The structural analysis is a central modeling tool that is reserved for Expert users. Many other analyses feed into the structural analysis, enabling master data, dependencies, and risks to be related and evaluated.
Visualization & Views
Viewing areas

There are several views in the structural analysis to avoid confronting the user with an oversized and confusing graph. These five perspectives are available:
- The organizational view focuses on the organizational structure of the company/group/association.
- The resource view represents the technical landscape and maps IT systems, specialized systems, building security, etc.
- The data view shows which data is processed in which organizational units or processes.
- The process view provides an overview of the business processes.
- The supplier view allows you to model the suppliers on which your organization, especially its IT systems, depends.
One view always constitutes the main view. The main view can be selected via the circular radio button or by double clicking the name of the view. Additional nodes from other views can be added to the main view. The link-buttons next to the the names of the views will take you to the respective administration pages in the tool.
Organization view
The organizational structure is described in Organizational Units.

A company consists of organizational units that are involved in various processing activities. These processes take place within one or more units and are usually IT-supported, with data being processed in the individual process steps.
From this perspective, key questions can be answered, such as dependencies on IT systems, risks to availability, confidentiality, and integrity (e.g., from business impact analyses), as well as the types of data processed and activities per organizational unit.
As a general rule: the more critical an organizational unit, the higher the potential damage — and the stricter the requirements for availability, confidentiality, and integrity.
Therefore, you must map the organizational structure and enter it either here or under Administration > Organizational Units.
You can also perform a protection need analysis to determine the business impact of IT services on the department’s day-to-day operations (Determine the Criticality of an Organizational Unit)
Resource view

The resource view represents the technical landscape, depicting IT systems, specialized systems, building security, etc. The risk analysis is also carried out using this representation. Deviations in risk assessment in both technical and organizational areas become apparent here. Based on this, measures to eliminate the deviations must be planned.
This view of the IT systems, which can be divided into several categories, shows how dependencies between the systems exist. Any interactions can be illustrated in the structural analysis. You can find more about this under Resources.
Example: The three SAP modules run on the same server cluster and the same database. Therefore, a failure of the server or the database would affect all three modules. (You can learn more about relationships between elements further below)
Data view

In the data view, the structure of the managed data categories becomes apparent. In addition, relationships (see below) can be used to determine which data is processed in which organizational units, resources, or processes, who the data owners are, and how the data is classified (into distinctions between data classes or between personal and non-personal data).
If this view is linked with the process view, it becomes clear which data is processed in which processes. The creation and structuring of data categories is described in the article data categories.
Process view

In the process view, you can see all processes with their hierarchy. Processes make it clear which processes exist, which data they process, which resources are linked to them, and how strongly an organizational unit depends on a process and vice versa. How to create and structure processes is described in the article Processes.
Supplier view
If the add-on Supplier Risk Management is activated, you will see all suppliers in the supplier view. Normally, they are not connected to each other. This makes it even more important to understand which organizational units, resources, data, and processes they are associated with and which risks are linked to them.

Relationships between elements
Structural elements (business applications or IT infrastructure services) can be related to each other. These relationships are either hierarchical relationships or dependency relationships.

Hierarchical relationships, also called parent-child relationships, exist between entities within a view. They describe that one element is partly composed of another. A process can consist of subprocesses, data categories can contain other data categories, and organizational units together form larger organizations. Therefore, these hierarchical parent-child relationships only exist within the organizational, data category, and process views. Hierarchical relationships are represented by a simple line.
- Example: Organizational units, processes, and data categories with hierarchical relationships
- Example: Organizational units, processes, and data categories with hierarchical relationships
Dependency relationships, on the other hand, illustrate that an element depends on another. This is the case for resources: an application runs on a server and is thus dependent on it in order to function. Additionally, dependency relationships can exist between different types of master data: if an application is provided by an external service provider, it depends on that supplier. If the employees of an organizational unit use an application, the organizational unit depends on the application. Dependency relationships are always depicted as arrows, with the element that depends on another pointing to the element that it needs in order to function.
- Example: The organizational unit “Procurement” depends on the applications BankingPortal and SAP MM. While BankingPortal depends on an external service provider, SAP runs on a server within the organization.
- Example: The organizational unit “Procurement” depends on the applications BankingPortal and SAP MM. While BankingPortal depends on an external service provider, SAP runs on a server within the organization.

Such a dependency relationship is composed of different protection objectives. The degree of dependency can vary for each protection target. For procurement, for example, it is very important that the integrity of the data in the Application "BankingPortal" is correct; otherwise, incorrect payments would be processed. However, if the application is unavailable for some time, the impact on the company is expected to be lower, as payments can also be processed on another day.
- Example: Switch from “Show bundled” to “Show all” in the navigation box, and you will see that there is a dependency relationship for each protection target.
The degree of dependency is weighted using a percentage value. By default, the dependency relationship is weighted at 100%, but other weightings are also possible. Typically, these weightings are determined by conducting a protection needs analysis. HITGuard will translate the results of the protection needs analysis into the weightings of the dependency relationships. The background setting for this function is called “PNA edge weight.” You can find it in the risk policy. Attention: If the first protection needs analysis has not yet been completed, all weightings will be 100% (HITGuard always assumes the worst case in this respect). Only once the protection needs analysis has been completed will the actual weightings of the damage extents be entered.
Creating and editing dependency relationships:

To create a dependency relationship, first locate the element from which the relationship should originate (the deendent element). Right-click on the element and select "Add relationship" from the menu. Then left-click on the element with which you want to create the relationship (start point to end point)
To delete a relationship, double-click on the relationship to open the detail page. There you can delete the relationship using the trash can button. Do not forget to click "Save" afterwards so that the relationship is actually deleted.
Working with the structure analysis
The following figure shows the configuration area of the structural analysis on the right:

- You can switch between the "Design mode" and the "Analysis mode" by clicking on the switch button. This button always shows the currently active mode.
- Double-clicking on a view changes it to the main view. This can also be achieved using the radio
buttons. The underlined view is always the main view. All entities are always displayed from the main view!
- In the individual views you can select which elements should be displayed in the current context.
- In the organization layer there is an additional option for selecting all organizational units active in the management system.
- If you select a node, all organizational units below it are also activated. If you want to avoid this, you need to select the node with a right click and a click on "Select".
- Resource groups can be shown and hidden in the resource view.
- In the organization layer there is an additional option for selecting all organizational units active in the management system.
- Change in the menu configurations must be clicked on "Apply" to make the change effective.
- The cloud icons allow you to save the current configuration or load an existing one.
Important: Select damage extent classification!
- If more than one damage extent classification exists, then they are selectable here. Only SBA protection target weightings of the current damage extent classification are displayed. Furthermore, the Protection target weighting of a protection target is displayed, if available.
By clicking on a risk, a dialog opens through which you can switch to the detail page of the risk.

Combine views
In addition to the main view, individual or all entities from other views can also be displayed. The combination of views is freely configurable, i.e. there are no restrictions on how the views can be combined. To add another view to the main view, you have to select the check mark in the navigation area of the structure analysis for the desired view and then click on "Apply".
The combination of views is especially practical when connections between different entity types are to be created or analyzed. These combined views can be saved as configurations for reuse, for example, to analyze the impact of a measure.
Note:
- In the organization view every unit can be shown and hidden individually. If you select a node, all organizational units below it are also activated. If you want to avoid this, you need to select the node with a right click and a click on "Select". This selects the unit without the units below it.
- For resources, you cannot show and hide individual resources. Instead, you can show and hide model segments as well as resource groups collectively. If you want to hide resource groups, you must not forget to deselect the model segment above it. Available model segments are: Business Service Level, Application Level, IT-infrastructure Level, OT-Infrastructure Level, Physical Security, Process Level.
- Data categories can be shown and hidden like organizational units.
- Processes can be shown and hidden like organizational units.
- Suppliers (only available if the add-on is activated) can be shown and hidden like organizational units.
Important:
- Depending on whether you are working in design or analysis mode, all or only explicitly selected entities (namely those to which relationships already exist from the main view) are displayed from the additionally selected views.
Find node (Alt + s)
In more extensive views, the search is supported to quickly get to a specific node.
To do this, enter the search term of the node in the "Find node..." field and complete your entry with the Enter or Enter key. The search then centers the first node found. If the Enter or Enter key is pressed again, the next node found is centered, and so on. When the end of the search result is reached, a message is displayed. If the Enter key is pressed again, the first search result is displayed again.
The search is case-insensitive. Special word beginnings, endings or phrases can be found with an asterisk (*):
- sap* finds "SAP MM" and "SAP HCM" and "SAP FI/CO," for example,
- sap*co finds "SAP FI/CO",
- *mm finds "SAP MM" and "HR master".
- fi* finds "SAP FI/CO" and "Finance".
Configurations
Configurations save all settings that were available at the time of saving. I.e. it saves which view was the main view, which views or entities were additionally displayed, how the protection targets are displayed and whether the risks should be displayed.
Configurations can be used above all to divide large and complex structures into different configurations and thus display them in a clear manner. This makes working with large structures much easier.
The cloud icons can be used to save the current configuration or to load an existing configuration.
Example of the use of a configuration:
- A protection needs analysis was performed and the impact was analyzed in the structural analysis. The next step is to define and implement measures for the risks that have arisen. If the previously performed structural analysis is stored in a configuration, the same analysis can be performed again with comparably little effort and thus the effects of the measures can be analyzed.
Show dependencies
Right-clicking on a node in the graph opens a context menu with the option "Show dependencies".
This option allows to limit the structure analysis to the elements relevant for the selected node. This can help to get a better and clearer overview of the dependencies and also facilitates the analysis.
An example to clarify: I am just interested in the resource SAP MM and would like to know what this resource depends on, but I have a hard time seeing this because so many nodes are displayed.
I can right click on SAP MM and select "Show dependencies". This hides all non-relevant nodes and gives me a much better overview.
 |
 |
| richt click with menu | resulting view |
Draft mode
In design mode, you can place elements from the selected views in connections and define their dependencies based on protection goals. However, you cannot edit connections or protection goal weights if they have been defined by a protection needs analysis. To edit them, you must perform a new protection needs analysis.
In design mode, all entities from the selected views are displayed. This has the purpose that relationships can be created between all elements.
Move elements
You can move elements individually or several elements at the same time. To move an element individually you have to move the mouse pointer over the desired element and click and hold the left mouse button.
To move multiple elements you have two options:
- Hold down the left mouse button until a cross appears. Then drag the rectangle over the elements you want to move.
- Hold down CTRL to select multiple elements by clicking on them.


Create / edit node
To connect elements with each other there are several possibilities:
- Right-click on an element and select "Add relationship". Then select other element. (Starting point to end point)
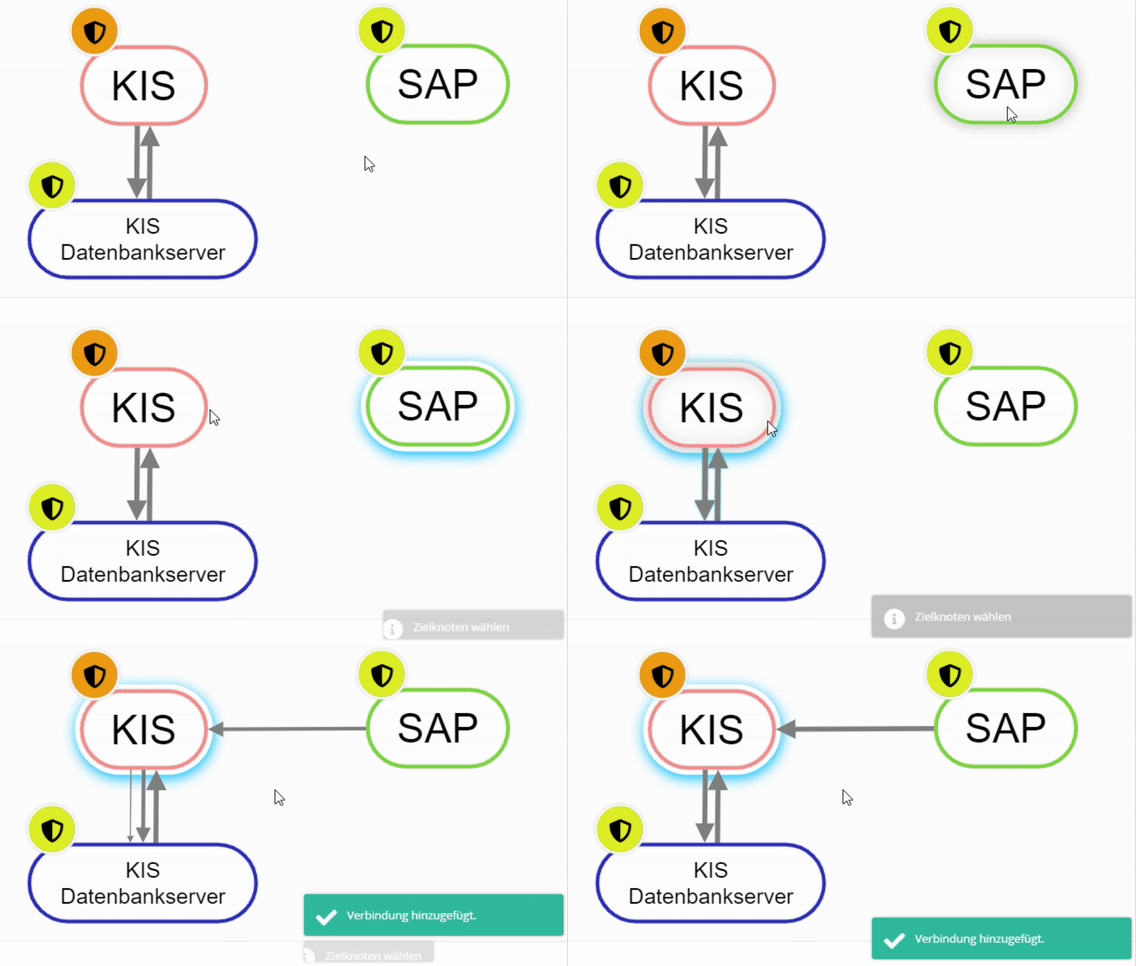
Create node with right click - Hold down "Alt" and select element 1, then click on the second element.
Create node with "Alt"-pressed - For data, processes, and organizational units, if you double-click the item, you can select a parent item in the mask or unlink it from the parent item.
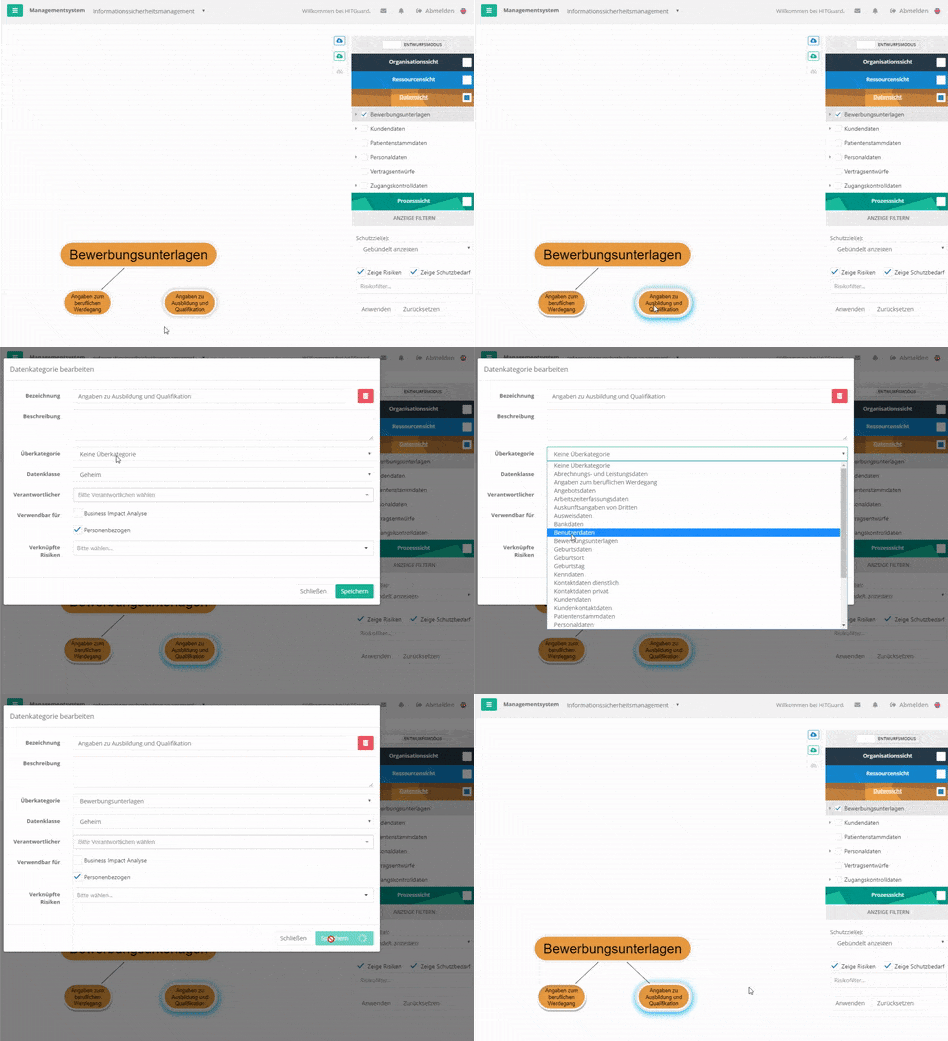
Create data-category node via mask - For resources, if you double-click on the element, you can create new connections or edit existing ones via the "Relationships" tab in the mask.
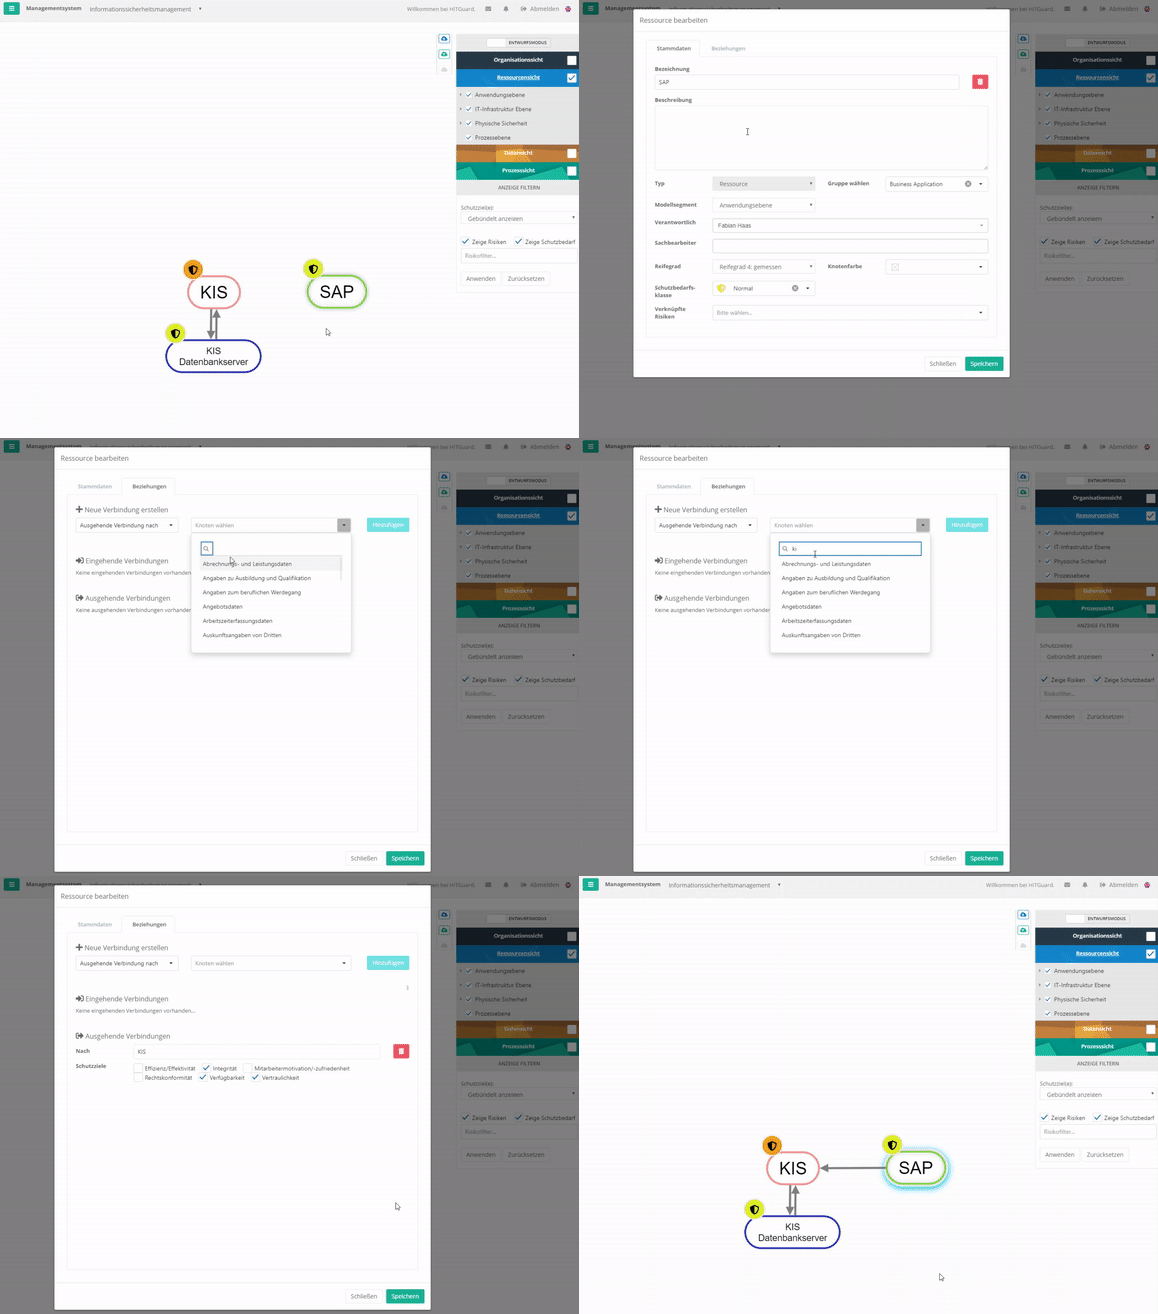
Create Node of a Resource


Edit/delete protection target
The connection with resources always happens with protection goals. However, you can adapt these protection goals. Exceptions are protection goals that have been weighted by protection needs analyses. These can only be changed by a new protection needs analysis (to create protection targets see protection targets), even if you can normally delete them.

To edit the protection targets of a connection you have to either double-click on the connection arrows or double-click on the element and switch to the "Relations" tab. With the latter option, no weightings can be set. Here, a 100% weighting is always assumed.


Create / edit / delete elements
Right-click into the empty space in the structure analysis to create new resources, organizational units, processes or data categories. If you now select an element to create, the respective mask for creating the new element opens.
Note: If a sub- or superordinate resource is created, it is automatically created as the type resource and this cannot be changed.
Double-click on an element to open its "edit" mask. Here you can also delete the elements.
For more details see Resources, Organizational Unit, Processes, Data Category create / edit / delete.

Analysis mode
The analysis mode is used to analyze the company structure. You can analyze which elements are dependent on each other and in what way. For this you can choose how the dependency should be displayed:
- What do I depend on?
- What do I depend on?
Additionally you can define a threshold value. This determines from which percentage dependency a connection between 2 elements should be displayed.
Analysis mode displays only entities from the selected views that are related to an entity from the main view.
What depends on me?
This can be used to analyze how much other entities, in terms of their protection goals, depend on an entity.
It is also possible to examine how risks affect the entire structure. It is also possible to examine how they affect the individual protection goals. This makes it possible to quickly identify how a risk affects other entities.
Entities on which the selected entity does not depend are grayed out.


What do I depend on?
This can be used to examine how much an entity depends on other entities in terms of its protection targets.
The dependency can be examined on a protection goal basis either bundled or individually for each protection goal. By changing the threshold value, you can set the percentage weighting of the protection goal from which you depend on an entity.
Entities on which the selected entity does not depend are displayed in gray.

RTO and RPO fulfillment
In the structural analysis, the fulfillment of the RTO (Recovery Time Objective) and RPO (Recovery Point Objective) can also be analyzed.

Attention:
In order for RTO or RPO fulfillment to be examined in the structural analysis, the RTO or RPO protection target must be activated under "Risk Management → Risk Policy → Protection Targets". Otherwise the checkboxes are not shown in the structural analysis.
The RTO or RPO fulfillment shows whether the protection requirement can be met with regard to RTO or RPO for the respective resources. For this purpose, the edge to the resources is weighted in the graph with a TARGET and ACTUAL. The target value is taken from a Protection requirement analysis . The ACTUAL is calculated from the respective dependent resources, i.e. the maximum time of all dependent resources for the RTO or RPO is determined.
Note: If you are in the combined view organization view (main view) and resource view (application layer shown) and at this point show RTO and RPO, you may see IS-values for the compliance that do not reflect the value of the resources below them. That is because all dependent resources (meaning the resources of all layers, even if they are not shown) are calculated. You can show this by enabling Show dependencies for the organizational unit.
'Procedure
- Protection needs analysis
- In order to analyze whether the RPO or RTO for a resource is met, a protection needs analysis for the resources must first be performed with an organizational unit or process owner. This results in the TARGET or no requirement.
- Evaluate resources
- In order to calculate the ACTUAL for RTO or RPO, the resources on which the organizational unit or process to be examined depends must be evaluated according to RTO or RPO. There are three possibilities for this:
- not evaluated:
- RTO or RPO has not yet been evaluated / entered. These values are not included in the calculation, but are marked as not yet evaluated (yellow gear wheel for RTO and yellow clock for RPO).
- In order to calculate the ACTUAL for RTO or RPO, the resources on which the organizational unit or process to be examined depends must be evaluated according to RTO or RPO. There are three possibilities for this:

- undefined / not relevant:
- The RTO or RPO is not further relevant for the calculation. These values are also not included in the calculation, but are marked with a gray symbol to show that these values were deliberately not deposited.

- RTO recovery time or the RPO backup interval is present:
- The RTO or RPO has already been determined for resources. These values can then be stored for the resources.
- For RTO there is the additional option that the recovery time of third party resources are secured e.g. by a SLA. This SLA can be deposited with the resource.
- N / B means net or gross. Net is the value that is entered directly at the resource. Gross is the maximum time reached by all dependent paths (only longest path is relevant).

- Analyze RTO or RPO Fulfillment:
- In order to analyze fulfillment, at least the organization view and resource view must be selected in the structure analysis. If these are selected, it is necessary to switch to the analysis mode (switch at the very top of the right menu). In the analysis mode, RTO or RPO fulfillment can now be selected.
- If too many non-relevant resources or organizational units are displayed, one can right-click on the organizational unit to be analyzed and select the item "Show dependencies" in the context menu. This will hide all non-relevant nodes.

implementation of a structural analysis
Organizational units or business processes use resources (business applications, communication services, medical administrative applications, etc.). Therefore, several applications can be assigned to several organizational units. The protection needs analysis weights the relationship between the respective organizational unit and the resource (e.g. very low risk to catastrophic risk).
The application has different weightings for different business areas with regard to its protection goals. The most critical weighting specifies how technically demanding the resource must be designed with regard to its protection goals, e.g., availability, confidentiality, or integrity. In this way, critical risks can be defined for the applications based on the weighting of their protection goals.
'Example:
- Confidential customer data is stored on a hard disk. This data is rarely used in the HIS, so its availability has been weighted to 20%. However, the confidentiality is 100% because it is confidential data. This allows, for example, the risks of theft and server failure to be identified. By weighting, it can be seen that theft of confidential data is much more critical than server failure. That is, theft would be a critical risk, but server failure would not.
Resources may be interdependent. There may be resources that are not functional or have limited functionality if another resource is not available. Resources require, for example, an IT infrastructure, data storage and possibly medical devices in order to be functional.
These dependencies can also be bidirectional. This would be the case, for example, if two resources (e.g. applications) actively exchange data. If one of them were to fail, this would affect the other resource.
All these dependencies can be analyzed via structural analysis.
Screen configuration
In the bottom left corner of the structural analysis view you find five options:
- Zoom bar: zoom in or out of the view
- Fit to screen: center the structural analysis on your screen
- Rearrange elements: let the tool position the elements automatically
- Lock all/Unlock all: lock or unlock all the elements' positions
- Toggle fullscreen mode: use the full screen for your structural analysis
Tips, tricks & best practice

- Sometimes, less is more. Especially at the beginning of working with the tool, an imported CMDB can lead to more pain than gain if a user is faced with a veritable mountain of assets into which they want to incorporate relationships and comprehensible dependences.
- Rather, build your management system step by step. Model the organizational structure with the most vital areas of your company. Collect the core processes and the most important services of your organization. Group and cluster similar elements (e.g., load balancing servers).
- Do not record central structural elements, such as the Active Directory, which is linked to almost all areas of business. It does not necessitate an analysis to know that an interruption of the AD would lead to a bigger problem in the company. Note: Of course, such an element can still be regarded and analyzed in HITGuard, especially regarding its security configuration. For this, HITGuard offers the gap analysis and its related functions.