Dashboard für Kontrollen/en: Unterschied zwischen den Versionen
Weitere Optionen
Faha (Diskussion | Beiträge) Die Seite wurde neu angelegt: „Here you can see the controls that have already been carried out and also how often the control has been performed successfully. Change the tab to see how many…“ |
Faha (Diskussion | Beiträge) Die Seite wurde neu angelegt: „In addition to the controls, you can see how many controls from each category exist in the selected management system.“ |
||
| Zeile 7: | Zeile 7: | ||
Here you can see the controls that have already been carried out and also how often the control has been performed successfully. Change the tab to see how many controls failed or were successful. Change to Total and you can see how often a control was performed. The star means it is a key control. You can sort by these by clicking on the left most column heading. | Here you can see the controls that have already been carried out and also how often the control has been performed successfully. Change the tab to see how many controls failed or were successful. Change to Total and you can see how often a control was performed. The star means it is a key control. You can sort by these by clicking on the left most column heading. | ||
In addition to the controls, you can see how many controls from each category exist in the selected management system. | |||
Version vom 13. Dezember 2019, 07:08 Uhr
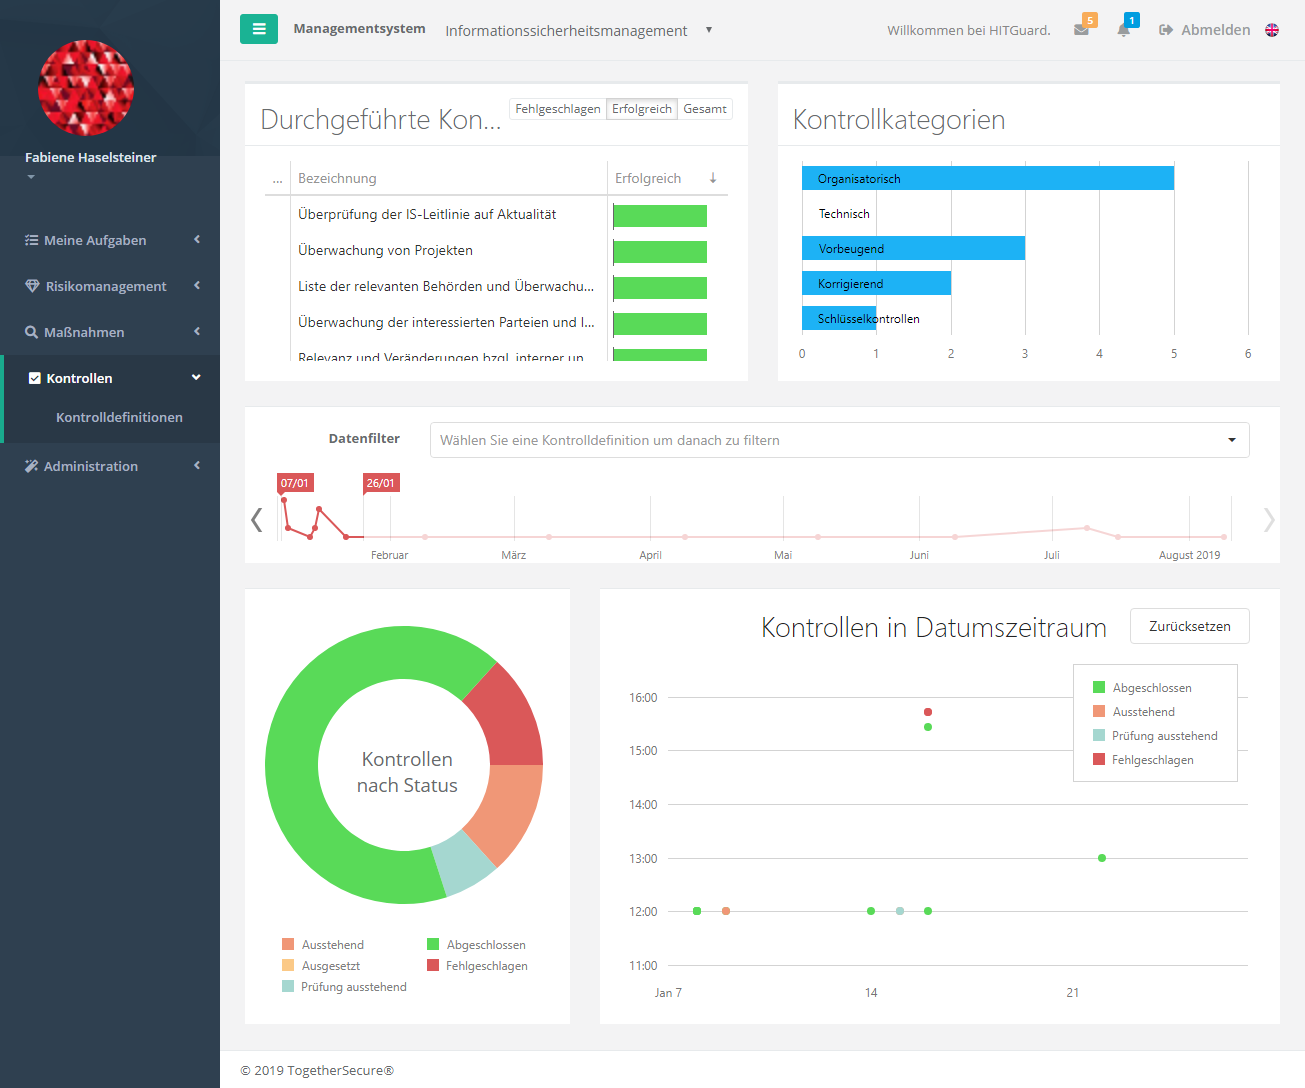
Under "Controls", experts and professionals are able to view the status of all controls within the active management system during the selected period.

Here you can see the controls that have already been carried out and also how often the control has been performed successfully. Change the tab to see how many controls failed or were successful. Change to Total and you can see how often a control was performed. The star means it is a key control. You can sort by these by clicking on the left most column heading.
In addition to the controls, you can see how many controls from each category exist in the selected management system.

Hier können Sie den Zeitraum oder die Kontrolle festlegen welchen/welche Sie analysieren möchten. Dafür kann der Zeitraum durch Verschieben der "Fähnchen" geändert werden. Durch klicken auf die Pfeile links und rechts können Sie das Jahr ändern. Über das Dropdown können Sie einzelne Kontrollen analysieren. Im Diagramm können Sie mithilfe des Mausrads hinein- oder herauszoomen. Hineinzommen geht ebenso über das Markieren eines Bereichs mithilfe der linken Maustate (halten). Durch klicken auf "Zurücksetzen" setzen Sie die Ansicht wieder auf 100% zurück.

Fahren Sie mit dem Mauszeiger im Diagramm über einer Kontrolle wird Ihnen angezeigt, wann diese durchgeführt wurde. Durch Doppelklick auf eine Kontrolle werden Sie zur Kontrolle weitergeleitet. Dies können Sie z.b. nutzen um herauszufinden wieso eine Kontrolle fehlgeschlagen ist.
