Dashboard für Kontrollen/en: Unterschied zwischen den Versionen
Weitere Optionen
Faha (Diskussion | Beiträge) Die Seite wurde neu angelegt: „Under "Controls", experts and professionals are able to view the status of all controls within the active management system during the selected period.“ |
Sala (Diskussion | Beiträge) Keine Bearbeitungszusammenfassung |
||
| (7 dazwischenliegende Versionen von 3 Benutzern werden nicht angezeigt) | |||
| Zeile 5: | Zeile 5: | ||
<br clear=all> | <br clear=all> | ||
Here you can see the controls that have already been carried out and also how often the control has been performed successfully. Change the tab to see how many controls failed or were successful. Change to Total and you can see how often a control was performed. The star means it is a key control. You can sort by these by clicking on the left most column heading. | |||
In addition to the controls, you can see how many controls from each category exist in the selected management system. | |||
| Zeile 14: | Zeile 14: | ||
Here you can specify the time period or the control which you want to analyze. The period can be changed by moving the "flags". By clicking on the arrows on the left and right you can change the year. The dropdown allows you to analyze individual controls. In the diagram you can zoom in or out with the mouse wheel. You can also zoom in by selecting an area using the left mouse button (Hold). Click Reset to reset the view back to 100%. | |||
| Zeile 21: | Zeile 21: | ||
Move the mouse pointer over a control in the diagram to see when it was performed. By double-clicking on a control, you are forwarded to the control. You can for example use this to find out why a control failed. | |||
[[Datei:Kontrollen Dashboard zu Kontrollen Navigieren.gif|left|thumb|900px|zur Kontrolle springen]] | [[Datei:Kontrollen Dashboard zu Kontrollen Navigieren.gif|left|thumb|900px|zur Kontrolle springen]] | ||
<br clear=all> | |||
If you double-click on a section in the pie chart, a mask opens displaying the corresponding controls. If you double-click on one of these controls, you will be redirected to it. | |||
[[Datei:Kontrollen Dashboard Kontrollen.PNG|left|thumb|900px|jump to control]] | |||
<br clear=all> | <br clear=all> | ||
Aktuelle Version vom 12. Januar 2021, 15:38 Uhr
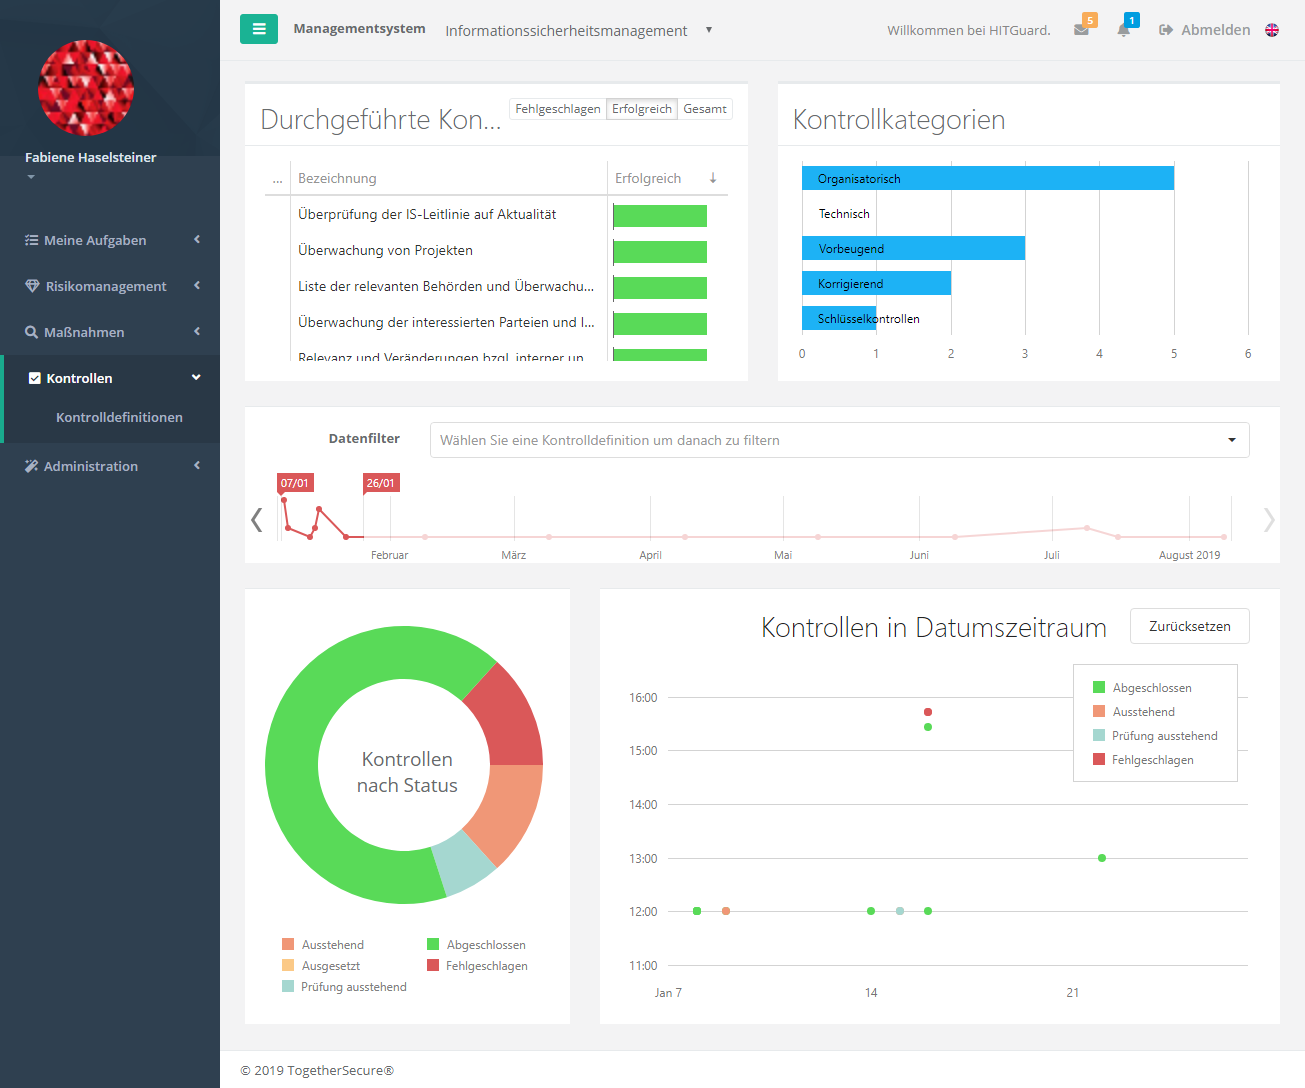
Under "Controls", experts and professionals are able to view the status of all controls within the active management system during the selected period.

Here you can see the controls that have already been carried out and also how often the control has been performed successfully. Change the tab to see how many controls failed or were successful. Change to Total and you can see how often a control was performed. The star means it is a key control. You can sort by these by clicking on the left most column heading.
In addition to the controls, you can see how many controls from each category exist in the selected management system.

Here you can specify the time period or the control which you want to analyze. The period can be changed by moving the "flags". By clicking on the arrows on the left and right you can change the year. The dropdown allows you to analyze individual controls. In the diagram you can zoom in or out with the mouse wheel. You can also zoom in by selecting an area using the left mouse button (Hold). Click Reset to reset the view back to 100%.

Move the mouse pointer over a control in the diagram to see when it was performed. By double-clicking on a control, you are forwarded to the control. You can for example use this to find out why a control failed.

If you double-click on a section in the pie chart, a mask opens displaying the corresponding controls. If you double-click on one of these controls, you will be redirected to it.
