ESG Dashboard/en: Unterschied zwischen den Versionen
Weitere Optionen
Übernehme Bearbeitung einer neuen Version der Quellseite |
Isan (Diskussion | Beiträge) Keine Bearbeitungszusammenfassung |
||
| (3 dazwischenliegende Versionen von 2 Benutzern werden nicht angezeigt) | |||
| Zeile 7: | Zeile 7: | ||
The following KPI is available for ESG. How to customize and create dashboards is described under [[Special:MyLanguage/Dashboards|create and edit dashboards]]. | The following KPI is available for ESG. How to customize and create dashboards is described under [[Special:MyLanguage/Dashboards|create and edit dashboards]]. | ||
===Double materiality=== | ===Double materiality=== | ||
This KPI offers information on the fields of action of the current management system. It is possible to configure, whether all fields of action are to be displayed (for this, select the lowest level), whether they should be grouped by areas (for this, select levels from the middle), or whether all fields should be summarized in one bubble (for this, select the top level).<p>The data is selected either in the editing mode, in the dialog window, or by activating data selection in the view mode. | This KPI offers information on the fields of action of the current management system. It is possible to configure, whether all fields of action are to be displayed (for this, select the lowest level), whether they should be grouped by areas (for this, select levels from the middle), or whether all fields should be summarized in one bubble (for this, select the top level).<p>The position of the bubbles is determined by their highest, absolute risk ratio (opportunities and risks) on the financial materiality axis, and the highest, absolute impact ratio (positive and negative impacts) on the impact materiality axis. (Find more on the impact ratio [[Special:MyLanguage/Auswirkungen#Berechnung_der_Auswirkungskennzahl|hier]].) A grey area can denote whether a field of action is material and therefore needs to be reported on (grey = not material). The thresholds for this are configured in the risk management settings.<p>With a checkbox you can also decide whether the names of the bubbles are allowed to cover each other or not. If they must not, then not all names are displayed, but are shown when you hover over the bubble with the mouse.<p>The data is selected either in the editing mode, in the dialog window, or by activating data selection in the view mode. | ||
[[Datei:KPI_DoppelteWesentlichkeitFilter.png|700px|left]] | [[Datei:KPI_DoppelteWesentlichkeitFilter.png|700px|left]] | ||
<br clear=all> | <br clear=all> | ||
Aktuelle Version vom 12. August 2025, 08:44 Uhr
The ESG section provides Experts, Professionals, and Observers information about the fields of action of the management system. For this, a key performance indicator (KPI) is available, which can add this information to any dashboard.
Caution: Only fields of action evaluated with the management system's classification of extent of damage and benefit are displayed.
ESG KPI
The following KPI is available for ESG. How to customize and create dashboards is described under create and edit dashboards.
Double materiality
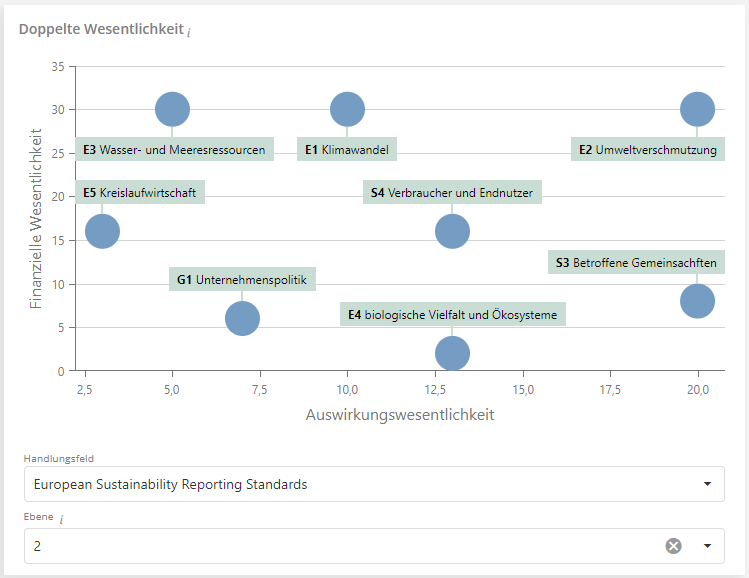
This KPI offers information on the fields of action of the current management system. It is possible to configure, whether all fields of action are to be displayed (for this, select the lowest level), whether they should be grouped by areas (for this, select levels from the middle), or whether all fields should be summarized in one bubble (for this, select the top level).
The position of the bubbles is determined by their highest, absolute risk ratio (opportunities and risks) on the financial materiality axis, and the highest, absolute impact ratio (positive and negative impacts) on the impact materiality axis. (Find more on the impact ratio hier.) A grey area can denote whether a field of action is material and therefore needs to be reported on (grey = not material). The thresholds for this are configured in the risk management settings.
With a checkbox you can also decide whether the names of the bubbles are allowed to cover each other or not. If they must not, then not all names are displayed, but are shown when you hover over the bubble with the mouse.
The data is selected either in the editing mode, in the dialog window, or by activating data selection in the view mode.
