Dashboards/en: Unterschied zwischen den Versionen
Weitere Optionen
Isan (Diskussion | Beiträge) Keine Bearbeitungszusammenfassung |
Isan (Diskussion | Beiträge) Keine Bearbeitungszusammenfassung |
||
| (Eine dazwischenliegende Version von einem anderen Benutzer wird nicht angezeigt) | |||
| Zeile 65: | Zeile 65: | ||
<u>Private:</u> | <u>Private:</u> | ||
[[Datei:Dashboard privat icon.png|right|400px]] | [[Datei:Dashboard privat icon.png|right|400px]] | ||
* If the new dashboard is marked as private, only the user who created the dashboard can access it. Dashboards that are not private are available to all authorized members of the management system. | * If the new dashboard is marked as private, only the user who created the dashboard can access it. Dashboards that are not private are available to all authorized members of the management system. You cannot set another user's created dashboard as private for yourself, this is always only possible for the creator themselves. | ||
* A private dashboard is identifiable by an icon in the upper right corner. | * A private dashboard is identifiable by an icon in the upper right corner. | ||
Aktuelle Version vom 29. Juli 2025, 09:42 Uhr
Dashboards
To be able to edit or create dashboards, a dashboard must first be selected. Then, the small gears at the top right of the menu must be clicked. Clicking the gears will switch the dashboard into the editing mode.

Editing mode
In the editing mode, a dashboard can be edited, reset or deleted (except default dashboards). Here, you also find a button for creating new dashboards. The buttons for this are located in the top right corner.

Below the buttons, the key performance indicators (KPIs) available for the current dashboard are listed. The are sorted into sections.
These KPIs can be added to the current dashboard via drag & drop. The KPIs that are already on the dashboard can be rearranged via drag & drop as well. After creating a new dashboard it is completely empty and can be filled with KPIs as desired.
For most KPIs, the data source needs to be set. There are the following options for this:
- Show data selection in view mode: If the checkbox is selected, the filters and choices are shown directly on the KPI in view mode as well.
- Users can modify the data source for the current view on directly on the dashboard at any time. These changes are not permanently saved.
- If the editing mode is opened and Save is clicked there, the changes made in the view mode are permanently saved.
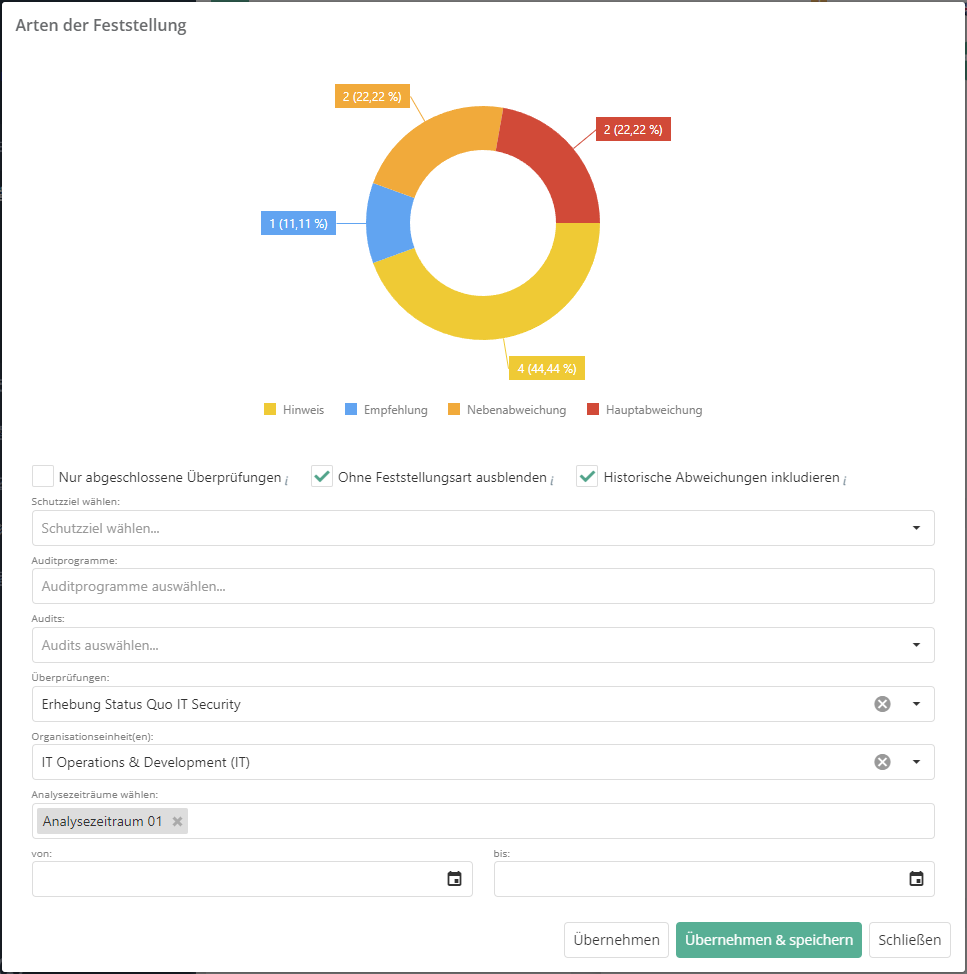
- Do not show data selection in view mode: If the checkbox is not selected, the filters and choices are not shown on the KPI in view mode. Instead, the KPI has a "filter" button which opens a dialog window displaying all the checkboxes, dropdowns, etc. A preview of the KPI graphic is also displayed there.
- The choice made in this dialog window can be applied to the current view with "Apply". It can be permanantly saved with "Apply & save" and is then also visible for other users using the same dashboard. It can be discarded with "close".
- Note: If the editing mode is opened and Save is clicked there, all changes that were previously only fixed with "Apply" are also saved permananely.

Adding, deleting, resizing, and replacing of KPIs is only possible in the editing mode.
If the data selection is shown in the view mode, the KPI is not automatically resized. Instead, it is possible to scroll to the various options within the KPI if the available view is too small. For this, there is a scrollbar at the right edge of the KPI.

The KPIs can be resized in the editing mode. To do this, hover the mouse over the KPI and click the "double arrow" icon in the bottom right corner of the KPI.

The display title of the KPIs can be customized via the text field of the KPI in the editing mode.

KPIs can be exported as JPEG, PNG and SVG using the "download" button.

To remove a KPI from the dashboard, hover the mouse over the KPI in the editing mode and click the "trash can" button of the KPI.

Create/edit dashboard
To create a new dashboard, you need to click on the "plus" button on the top right while in the editing mode.
To edit the meta information of the currently displayed dashboard, click the "pencil" button next to the "plus" button in the top right corner.
A dialog for creating/editing a dashboard will then open.

Private:

- If the new dashboard is marked as private, only the user who created the dashboard can access it. Dashboards that are not private are available to all authorized members of the management system. You cannot set another user's created dashboard as private for yourself, this is always only possible for the creator themselves.
- A private dashboard is identifiable by an icon in the upper right corner.
Code and name:
- After the dashboard is created, it is listed in the menu with its name. If the name is too long for the menu, the code is displayed. If no code is given, the name is cut off with "..." after 14 characters.
Sorting order:

- Affects the order of the dashboards in the menu. The dashboard marked as "favorite" is listed above all other dashboards.
Description:
- Describes what the dashboard is used for.
Reset/delete dashboard
Dashboards can be reset to their initial state by clicking the "reset" button next to the red "trash can" button at the top right. For self-created dashboards, tihs means it is empty again and new KPIs can be added.
By clicking the red "trash can" button in the top right corner, a dashboard can be deleted. Deleting is not possible for default dashboards.